Tracking Impact: What and How to Measure What You Achieve
In my conversations with nonprofit leaders and founders over the last week, a question kept recurring about how to do what I like to call “tracking impact.” In other words, how to measure your outcomes and impact. So, let’s get right to it!
The four steps for tracking impact are:
- Determine what impact you do have and/or want to have.
- Figure out which of your activities are measurable.
- Create and incorporate a system into your operations that make tracking easy.
- Analyze data collected and report on it.
Sounds simple, right? Well, let’s break down the steps.
Step 1: Know your Impact
If you have established your 501(c)3 nonprofit, some of this is already incorporated into your mission statement. This is the “why” of your nonprofit. If you’ve not already done so, I recommend conducting a strategic planning process to dig a little deeper and more specifically articulate your mission statement. Learn more about the benefits of a strategic planning process from the Growing Your Good Work blog.
Step 2: Outline and Categorize Your Activities for Tracking Impact
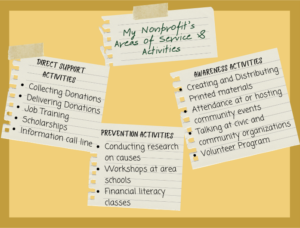
For Step 2, separate your activities in categories or areas of service or mission fulfillment. This will help you to really think about all the things your organization does. For example, you may be collecting donations of and delivering toiletries to families living below the poverty line, raising awareness about the prevalence of poverty, and working to prevent it. In this scenario, make a heading for each of those separate areas and then below, write down everything you do under that heading. It might look like this:

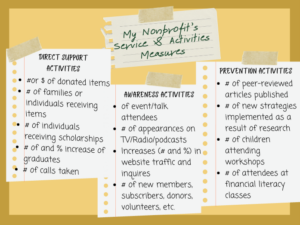
Some of these activities can obviously be in more than one category. In that case, put it under the category that represents the primary purpose of the activity. After going through this exercise, figure out what part of each of your activities can be measured in some way. Using the example above, here are some possibilities:

You’ll notice a lot of # with a few %. How many, how often, or what is the increase or decrease over time, are primary measurement tools. Numerical data readily demonstrates the outputs and outcomes of your activities.
Step 3a: Incorporate Tracking Systems in Your Activities to Collect Data
Think about how you operate and conduct your activities on a daily basis. Then consider how within that existing operation you can collect data points listed above. It may be as simple as creating a form (digital or paper) for volunteers or staff to record numbers as they work on an activity. Filling out forms or other steps need to be included in Standard Operating Procedures (SOPs) and shared with all staff and volunteers. Other data points, such as scholarship money and new members, may already be collected in existing systems for accounting and marketing.
Step 3b: Qualitative Data Collection for Tracking Impact
Another element of measurement is showing impact to and getting feedback from those you serve. This goes beyond tracking concrete numbers of direct outputs. This measures the quality and effectiveness of your services and programs as they relate to your mission and goals.
For example, in addition to measuring how many scholarships were awarded, you want to find out if the scholarships increase likelihood of graduation and rising above poverty levels. You may also want to survey your beneficiaries for testimonials and formally via surveys. If you create a formal survey, keep in mind that these are not as straightforward as collecting numerical data. Survey templates from Surveymonkey.com will get you started thinking about how to write your survey questions, and there are additional resources at the end of the blog.
Tracking Impact Step 4: Analyze Collected Data and Report on it
Once you have systems and SOPs in place to collect data, you need to create a spreadsheet or database to input the data. Watch this tutorial for more information on how to do this in Google Sheets, which are free to anyone with a Google account.
Columns in the spreadsheet or database would be the same as the headings from forms you created for data collection. It may be easiest to create a separate worksheet for each data collection form or data point.
Using the steps in the tutorial, you can easily calculate the number of donations and individuals served. You can determine which program had the most participants, or which had the highest percentage of outcomes you were working toward. To report this data in an easy to read, graphically pleasing format, create charts and graphs showing the data using steps in this “how to” from Google.
Overwhelmed with these four “simple” steps for tracking impact?
We can help! Fill out the form under my picture to set up your free consultation to learn how we can help you with all four steps. And, don’t forget to check out my other blog posts about starting and Growing Your Good work!
FOR FURTHER READING
WRITING SURVEYS TO MEASURE IMPACT:
Event Survey Questions sample from the Bizzabo Blog
Civic Tech Assessment Resources 5: Sample Survey Questions from Civic Tech
GENERAL INFORMATION ABOUT MEASURING IMPACT
Quick Reference Guide & Annotated Logic Model Template from AEM Corporation– Logic models are a more formal way to determine what and how you will measure impact.
Ten Reasons Not to Measure Impact and What to Do Instead from Stanford Social Innovation Review
Impact Measurement Definition from You Matter
Best Practices on Measuring Impact from Sopact
What is Impact and How Do We Measure It? from Clear Impact


